Quality Management Overview
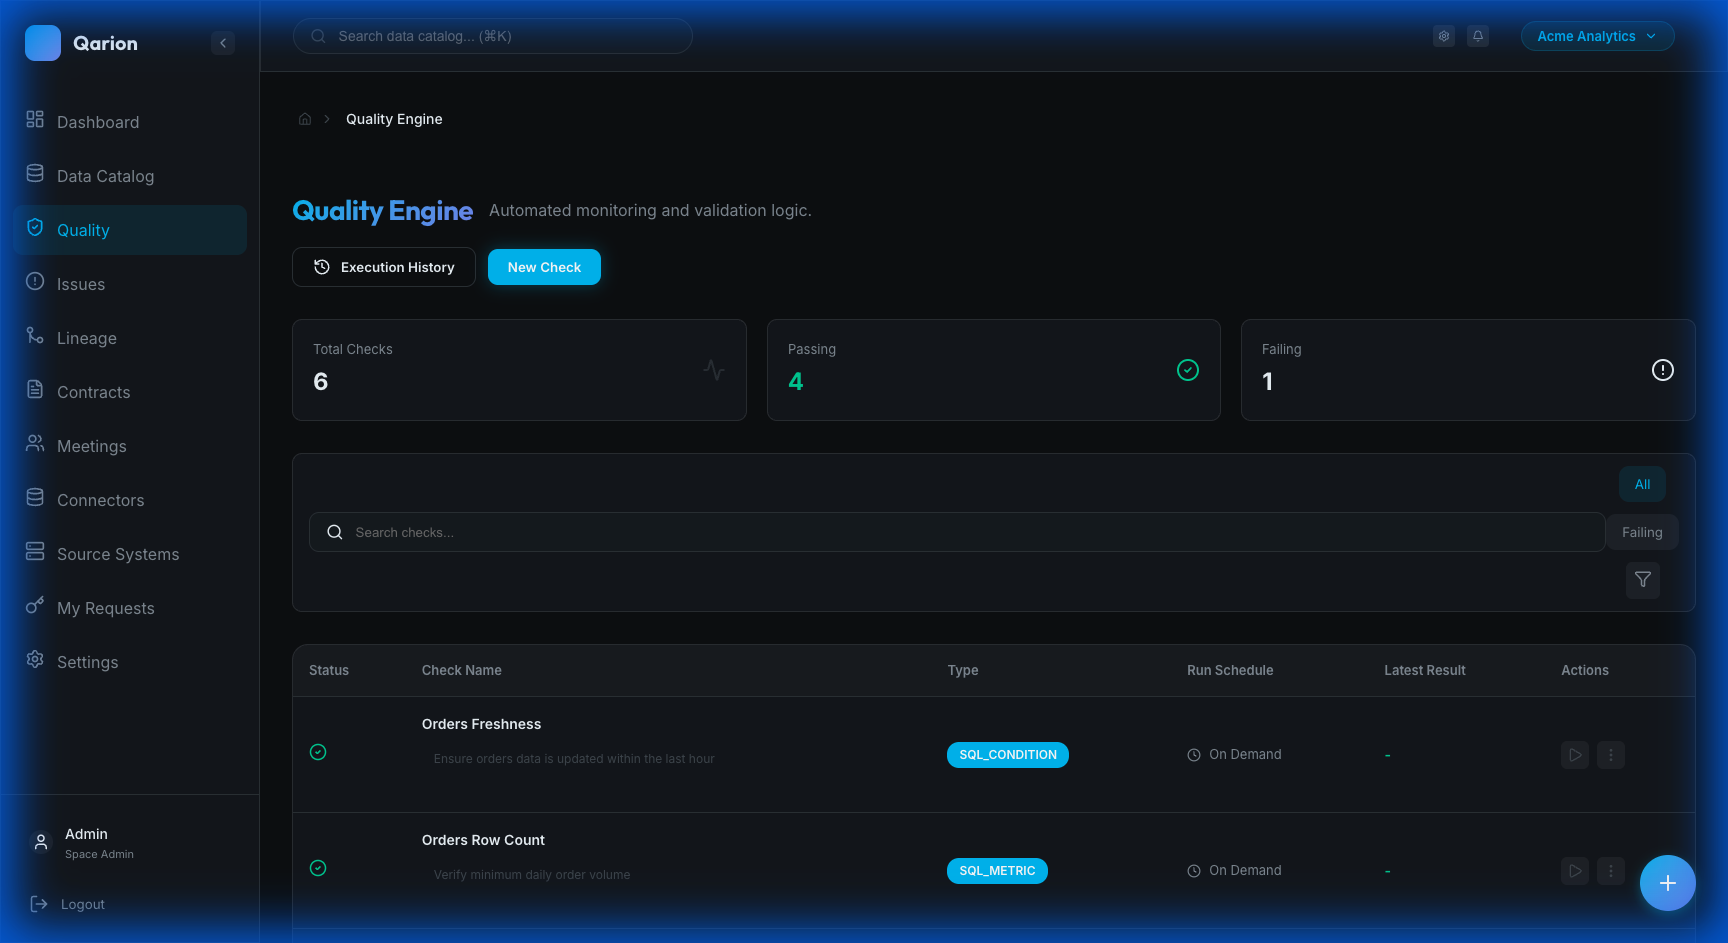
The Quality Management module helps you monitor data reliability through automated checks, trend analysis, and smart alerting.
Why Quality Management?
Data quality issues can have significant downstream impacts, leading to incorrect business decisions, failed analytics pipelines, broken dashboards, and a general loss of stakeholder trust. Qarion's Quality Engine provides early detection and systematic tracking to address these problems before they affect the business.
Core Concepts
Quality Checks
A Quality Check is a rule that validates an aspect of your data. Qarion supports various check types to cover different validation needs. SQL Metric checks return a numeric value from a query, while SQL Condition checks assert a specific condition, such as ensuring bad rows count is zero. For efficiency, Field Checks allow multiple validations on a single field. You can also run Reconciliation checks to compare source and target values, or Anomaly detection to spot deviations from historical baselines. Other types include Null Checks, Uniqueness constraints, Range Checks, Pattern Matching, and Freshness monitoring. Custom metrics can be pushed via API, and manual checks allow for human input.
Multi-Product Association
A single quality check can be linked to multiple data products, avoiding the need to duplicate shared validation logic. You can associate a check with one or many products during creation or editing. The pass or fail result of the check contributes to the Quality Score of every linked product, and the check appears on the detail pages of all associated products.
Query Parameters
SQL-based checks support parameterized queries using {{param}} placeholders. You can define parameters with specific types, default values, and descriptions. These are resolved at execution time, allowing for runtime overrides. This feature is particularly useful for creating reusable check templates that can adapt to different date ranges or environments.
Check Executions
Each time a quality check runs, it creates an Execution record. This record captures the timestamp of the run, the result (pass, fail, or warning), the actual measured value, and any error messages. For field checks, it also logs details like batch ID and field names.
Quality Trends
Aggregated execution data allows you to visualize patterns over time. You can track daily pass and fail counts, review historical reliability metrics, and analyze trends to catch deteriorating quality early.
Quality Engine Features
Automated Monitoring
You can schedule checks to run automatically and receive alerts whenever failures occur. The system tracks the full execution history, providing a complete audit trail of data health over time.
Product Integration
Quality is deeply integrated with the Data Catalog. You can view health status directly on product cards and see detailed quality trends within product pages. Creating checks is seamless from the product context, and thanks to multi-product association, a single check can span across multiple data assets.
External Integration
The Quality Engine integrates into your broader data ecosystem. You can trigger checks remotely via API using human-readable slugs or UUIDs, allowing integration with CI/CD pipelines and orchestrators like Airflow. Results can also be pushed from external tools like dbt.
Alerting
When checks fail, alerts are triggered in the Alerts Center. These alerts are prioritized by severity and can be converted into tickets for formal remediation workflows.
Governance
For critical checks, you can enforce governance protocols. Changes to rules can require approval through change requests, ensuring that modifications are vetted by stewards and fully audited.
Quality Metrics
Product Health Score
Products display a quality health indicator, which is aggregated from all associated checks. This provides a visual health badge in the catalog and detailed trend charts on the product detail page, giving users instant insight into data reliability.
Execution Statistics
The system tracks overall activity, including total executions per period, pass/fail rates, and the most common failure types. This high-level view helps identify systemic issues and track improvements.
Getting Started
1. Create Quality Checks
Start by defining checks for critical data products. Navigate to a product's Quality tab, click Add Quality Check, configure the check parameters, save, and optionally run it immediately.
2. Monitor Alerts
Keep an eye on the Alerts Center by reviewing new alerts daily, investigating failures, creating tickets for issues requiring action, and resolving alerts when they are addressed.
3. Analyze Trends
Use trend data to improve reliability. Review product quality charts to identify patterns in failures, allowing you to address root causes proactively and track improvement over time.
Module Navigation
The module is organized into several key areas. Quality Checks allows you to browse and manage all rules. Execution History provides a view of recent check runs across the space. The Alerts Center is your hub for monitoring and responding to failures. Continuous Monitoring covers drift detection for AI systems. The Product > Quality Tab offers a focused view for specific data assets.
Learn More
To dive deeper, explore Quality Checks for creating and managing quality rules, the Alerts Center guide for monitoring and responding to alerts, or Continuous Monitoring to learn about drift detection for AI systems.